Burke county

marathon

Senior Member
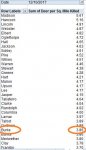
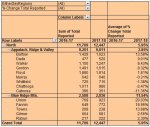
Is/was there just that many deer in Burke county? Looking at DNR harvest record map, Burke is head and shoulders above every other county as far as harvest numbers go with 3150. Closest county is Hancock with 2385. Seems like it was like that last year also. I would think eventually these numbers would catch up with them.
 

jeffersonbigbuck

Senior Member
Burke is a big county with a lot of agriculture and big hunting tracts. You can probably add another 500 that haven't been called in to that also!
 

redwards

Senior Member
It is all about the size of Burke County and the number of deer killed per square mile...
26 counties have higher report rate per square mile than Burke.
 

Attachments

  • Deerpersqmile.JPG
    Deerpersqmile.JPG
    52.8 KB · Views: 1,534

deerhuntingdawg

Senior Member
That’s a great statistic “per square mile”. Thanks for posting
 

fastball_24

Member
Ware 1 and Burke 2

That is correct but the problem is a good portion of Ware is under water because of the swamp so if you state true size that can be hunted on Burke would be the largest county but just land size.
 

nmurph

Senior Member
Ware Co is has 892 sq miles of land. Burke County has 827 sq miles of land.

Ware is the largest county east of the Mississippi. Lots of what is called the swamp is actually in the NWR and lots of that is flat land. Even within the swamp proper, there is lots of "dry" land. With all of that said, deer hunting in Wsre Co. is not the greatest as much of the county is covered in flat woods with little agriculture for miles.

BTW, the deer in the swamp have evolved webbed hooves.
 
Last edited:

Sixes

Senior Member
It is all about the size of Burke County and the number of deer killed per square mile...
26 counties have higher report rate per square mile than Burke.

That is the most informative chart that I have seen. Anyway you can post the rest of the counties? That tells more about an area than any harvest number.

I'd love to see the full totals after the season closes
 

redwards

Senior Member
That is the most informative chart that I have seen. Anyway you can post the rest of the counties? That tells more about an area than any harvest number.

I'd love to see the full totals after the season closes
I will post it after season ends.
 

EAGLE EYE 444

King Casanova
It is all about the size of Burke County and the number of deer killed per square mile...
26 counties have higher report rate per square mile than Burke.

That is the most informative chart that I have seen. Anyway you can post the rest of the counties? That tells more about an area than any harvest number.

I'd love to see the full totals after the season closes

I will post it after season ends.

You can also check the recorded kills on this website shown below as the kills are made and entered. It surely gives you more of an up to date picture of what is harvested in every county in Georgia. I also gives you much better information on how many bucks and does have been killed by archery, firearm or muzzle-loader.

I put this website into my Bookmarked/Favorites section so that I can keep reviewing it from time to time during the season.

Just click on this link:

https://gamecheckresults.gooutdoorsgeorgia.com/DeerByCounty.aspx
 

redwards

Senior Member
That is the most informative chart that I have seen. Anyway you can post the rest of the counties? That tells more about an area than any harvest number.

I'd love to see the full totals after the season closes

As requested....
Percent change in total deer reported...Arranged by Physio Graphic Region and sorted in descending order from highest(+) % change to lowest (-)
The 5 Physio Graphic Regions in the state are:

1. Appalachian Ridge & Valley
2. Blue Ridge Mountains
3. Piedmont Plateau
4. Upper Coastal Plains
5. Lower Coastal Plains
...
and Yes, I do realize these are just numbers, and that there are hunters who do not report what they kill...but these numbers do represent the change in what was/has been reported thru Game Check from 2016-17 season to 2017-18 season...so if anyone is going to knock the numbers, back it up with something that is quantifiable; otherwise it is nothing more than an opinion.
 

Attachments

  • post1.JPG
    post1.JPG
    59.1 KB · Views: 396
  • post4.JPG
    post4.JPG
    119.1 KB · Views: 398
  • post2.jpg
    post2.jpg
    79.8 KB · Views: 395
  • post3.jpg
    post3.jpg
    82.5 KB · Views: 397

marathon

Senior Member
Thanks for the chart redwards. Goes to show in the grand scheme of things statewide both seasons shown were fairly equal considering a difference of 1369 deer in 159 counties averages to 8.6 increase harvest per county. I know it doesn't seem like much, but I wonder if some of the less deer populated counties can sustain that level of harvest. After all, pennies do add up to dollars.
 

Sixes

Senior Member
Thanks for the information, it's interesting to see how some counties' kills increased while others decreased. This data will be even better in the next couple of years to see if a definite trend evolves.
 

redwards

Senior Member
Thanks for the chart redwards.
Goes to show in the grand scheme of things statewide both seasons shown were fairly equal considering
a difference of 1,369 deer in 159 counties averages to 8.6 increase harvest per county.
I know it doesn't seem like much, but I wonder if some of the less deer populated counties can sustain
that level of harvest. After all, pennies do add up to dollars.

Which then begs the question.

How did the total number reported arrive at a difference of 1,369 deer?

Bucks...113 counties show an increase in bucks reported and 46 counties show the same or less bucks reported.
71% increased vs. 29% decreased. Pretty significant swing!
Does...54 counties show an increase in does reported and 105 counties show the same or less does reported.
34% increased vs. 66% decreased. Another pretty significant swing!
In the 2016-17 season there were 89,034 bucks (males) reported and 93,760 does (females) reported,
compared to the 2017-18 season where 96,087 bucks (males) were reported and 88,076 does (females) were reported.

Probably there are people who would say that a decrease does reported in 66% of all Georgia counties
coupled with a decrease of 5,684 does reported overall could be an indication that does are being overharvested.
May be, may not be...I dunno.

What I do know is this.
Statewide Modern Firearms season lasted 6 days longer in 2017-18 than it did in 2016-17 (Jan 9th thru 14th).
In those 6 days alone, there were 5,722 does (females) reported.
My take on that is, more hunters were selective and took bucks rather than does throughout the season, but when
it came to crunch time (the last week of modern firearms season) they took the gloves off!
 
Top