jfarrell30339
Senior Member
So I've exhausted google and I can't find a current deer population density by county listing for Georgia. Oh there's data out there but it's all outdated in my opinion. Is there a 2017 or 2018 data set that anyone has access to?
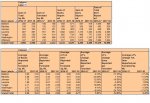
I've looked at harvest numbers and the most recent QDMA release which does give a general idea of density by region. Just wondering if a county by county listing is out there?
I've looked at harvest numbers and the most recent QDMA release which does give a general idea of density by region. Just wondering if a county by county listing is out there?

 Hows your grapes doing?